-
07 August 2025 | Policy Analysis
Budget legislation expected to result in 16 million more uninsured
7.2. Accessibility
Insurance coverage in the United States is not universal. In 2017 about 10% of those under the age of 65 did not have public or private health insurance – a substantial decline from the 17% figure in 2013, which was just before the major provisions of the ACA went into effect (Kaiser Family Foundation, 2018a). Those without health insurance – a group, not surprisingly, that is disproportionately represented by people with lower incomes – often do not have a regular physician and are likely to receive free or reduced fee care outside doctors’ offices (e.g. CHCs, EDs) or forgo some or all the services or prescription drugs that they need. Paying for care in the absence of insurance can cause financial strain and sometimes bankruptcy.
For the under-age 65 population in the United States, health insurance is largely tied to employment. Beginning in 2014, employers with more than 50 employees have been required to offer coverage. Other sources of coverage are Medicaid and individual health insurance policies, the latter purchased either through or outside the ACA marketplaces. Both of these options are discussed extensively below.
Budget legislation signed by President Trump in July 2025, combined with Congress’s decision not to extend “enhanced” premium subsidies in the Affordable Care Act (ACA) marketplaces, is predicted to increase the number of uninsured Americans by 16 million by the year 2034, according to the Congressional Budget Office (CBO) [1,2]. In 2024, it was estimated that there were 27.2 million uninsured Americans, well below the 49 million in 2010, prior to the implementation of the ACA [3, 4].
The new legislation, named the “One Big Beautiful Bill” (OBBB) Act, was intended to extend Trump’s tax legislation from his first term, which otherwise was about to expire. This required generating trillions of dollars in savings from government programs. Below, we discuss the major reasons that the number of uninsured Americans is expected to rise so much.
Medicaid work verification requirements
The CBO estimates the largest share of Medicaid savings ($326 billion over 10 years) to come from changing Medicaid expansion eligibility by implementing work requirements [5]. Prior to the OBBB, federal law prohibited linking Medicaid eligibility to working or looking for work. However, states could obtain waivers from the federal government to implement work requirements. These demonstration waivers were approved in several states during the first Trump administration, though later rescinded by the Biden administration. Georgia is currently the only state with an approved work requirement waiver, though more than a dozen have applied for waivers to implement them [6].
Under the OBBB, working-age individuals enrolled in or applying for Medicaid expansion in any state would be required to verify they are working or participating in qualifying activities (e.g., looking for work, job training) at least 80 hours per month. Parents of dependent children age 13 or younger or individuals who are medically frail are exempted from work requirements [7] (effective 31 December 2026, although the Secretary of Health and Human Services can extend this deadline by two years for states acting in good faith to implement the requirements).
Already, 64% of working-age individuals enrolled in Medicaid, who are not covered by disability insurance, report working part or full time [8]. Evidence from Arkansas’s attempt to implement a work requirement waiver in 2018 resulted in 25% (18,000) of those eligible for the work requirement losing Medicaid coverage, an increase in the uninsurance rate in the state, with no change in unemployment rates. Many people lost Medicaid because they had trouble reporting and verifying their work or other qualifying activities. Of the 13 states that had approved or in-progress demonstrations to implement work requirements during the first Trump administration, Michigan Medicaid was estimated to lose 100,000 otherwise eligible individuals due to work requirements, prior to a judge blocking implementation [10]. The CBO estimates that 18.5 million people will be subject to work requirements each year, and in 10 years, 5.2 million fewer adults will be enrolled in Medicaid. Few of these are expected to find other coverage, given provisions in the OBBB that those who are not eligible for Medicaid due to work requirements are also ineligible for marketplace subsidies, thus increasing the number of those without insurance by a further 4.8 million [11].
In addition to work requirements, the OBBB requires states to redetermine eligibility at least every 6 months instead of annually (effective 2026, resulting in a budget reduction of $63 billion over 10 years [12]). Further, retroactive coverage is limited to 1 month for expansion enrollees, a decrease from 3 months of retroactive coverage in federal law prior to the OBBB.
Other Medicaid changes
Changes to financing Medicaid expansion enacted through the OBBB include the elimination of temporary incentives (+5% to the federal matching rate for 2 years) for the 12 states that have not already expanded Medicaid, essentially disincentivizing those who have not expanded already to now do so (effective 1 January 2026) [13]. The OBBB will also limit federal matching for providing emergency services to individuals who would otherwise be eligible for Medicaid expansion but for their immigration status (effective 1 October 2026). Regarding premiums and out-of-pocket payments, the OBBB eliminates optional enrollment fees and premiums but requires states to charge up to $35 in cost-sharing for the expansion population. However, many services (e.g., primary care, mental health, substance use services) and providers (e.g., rural health clinics, federally qualified health centres) are exempt from cost sharing (effective 1 October 2028 [7] and expected to reduce the federal budget by $7 billion over 10 years).
Provider taxes that currently help finance Medicaid in many states will also be affected by the OBBB. Specifically, states that have expanded Medicaid will have the provider tax limit, referred to as the safe harbour limit, reduced from 6% to 3.5%. This policy is expected to decrease provider tax revenue for the state Medicaid program in 22 expansion states, mostly through taxes to hospitals on their net patient revenues [14]. These changes to provider taxes will begin in 2028 with 0.5% reductions occurring in expansion states until the 3.5% limit is reached and are expected to reduce federal Medicaid spending by $191 billion over 10 years [12]. In addition to financing changes specific to Medicaid expansion, more broadly, the OBBB includes new limits to payments that state Medicaid programs can make to hospitals and nursing facilities via Medicaid managed care programs, affecting provider payments in approximately 30 states [14] (effective upon enactment, expected to reduce the budget by $149 billion over 10 years).
Changes to marketplaces
While the original premium subsidies that went into effect in 2014 resulted in millions of Americans obtaining health insurance coverage, many were still unable to afford the premiums. One reason is that they were available only to those whose incomes were no more than four times the federal poverty level (currently, $15,650 for an individual and $32,150 for a family of four). Another consideration was that premiums could vary by a factor of three depending on age, resulting in older prospective purchasers frequently facing premiums that represented a significant portion of their income. In 2021, legislation passed under the Biden Administration expanded premium subsidies so that no one would pay more than 8.5% of their income for a so-called “benchmark plan.” Coverage became more affordable, particularly for people close to retirement. These enhanced subsidies will end after 2025, as Congress did not extend them under the OBBB. As a result, on average, policyholders will face more than a 75% increase in their out-of-pocket premiums [15, 2].
As noted, CBO predicts an increase of 16 million uninsured persons by 2034. An estimated 4.2 million will be the result of the expiration of the enhanced premiums. Another 0.9 million will be due to other changes made to the marketplaces. One of the most significant ones is the shortening of the open enrollment period from 2.5 months to 1.5 months.
Impacts on access to healthcare and health
OBBB provisions will lower access to healthcare in several ways. The drop in insured people due to Medicaid and ACA cuts will reduce patients’ ability to obtain healthcare. In addition, reductions in the number of insured will lead to financial distress for healthcare providers such as physicians and hospitals. This will result in a reduction in services and the closing of hospitals, further reducing access to care for many Americans [16]. Rural clinics and hospitals, which see a higher proportion of Medicaid patients, will be heavily affected.
Access to care will also be affected by limitations on the amount of federal loan money medical students can obtain [17], making it more difficult for students to finance medical school. This may discourage students from entering medical school, thereby exacerbating an existing physician shortage. Rural areas will be especially hard hit as they will need to pay physicians more for them to pay off their medical school debts.
The health impacts of the bill have been estimated. The estimates are based on drafts of the bill by the House or Senate and vary based on the estimated loss of insurance and services arising from the bills. Gaffney and colleagues estimate that, due to the loss of Medicaid and ACA insurance, the proposed House version of the bill would increase deaths by between 8,200 and 24,600 annually, with a mid-range of 16,642 [18]. The Leonard Davis Institute (LDI) at the University of Pennsylvania and the Center for Disease Modeling and Analysis at Yale University predict a total of 42,500 additional deaths annually from the bill’s changes: 11,300 due to people losing coverage from loss of Medicaid or ACA; 18,200 from low-income Medicare beneficiaries losing Medicaid prescription drug subsidies, and 13,000 from low staffing in nursing homes [19]. The LDI estimates that the impact of the loss of access to treatment for opioid use disorder will result in a doubling of the overdose rate, increasing the rate of fatal overdoses by approximately 1,000 each year [20]. The LDI also estimates that the projected loss of Supplemental Nutrition Assistance Program (SNAP) benefits by 3.2 million Americans will result in 93,000 premature deaths by 2029.
As of yet, there are no estimates of the impacts on health inequities, but it is evident that the insurance losses from this bill will be felt by lower-income and disadvantaged persons who rely on Medicaid and the ACA marketplace. The same can be said of the reductions in SNAP.
References
[1] Basu SY, Patel S, Berkowitz SA. Projected Health System and Economic Impacts of 2025 Medicaid Policy Proposals [Internet]. JAMA Health Forum. 2025 Jul 3;6(7):e253187 [cited 5 August 2025]. Available from: https://jamanetwork.com/journals/jama-health‑forum/fullarticle/2836460
[2] Congressional Budget Office. Letter to the Honorable Ron Wyden, Frank Pallone, Jr., and Richard E. Neal: Estimated effects on the number of uninsured people in 2034 resulting from policies incorporated within CBO’s baseline projections and H.R. 1 [Internet]. Washington, DC: CBO; 4 June 2025 [cited 5 August 2025]. Available from: https://www.cbo.gov/system/files/2025-06/Wyden-Pallone-Neal_Letter_6-4-25.pdf
[3] National Center for Health Statistics. U.S. uninsured rate drops 15% since 2020 [Internet]. Washington, DC: NCHS; 24 June 2025 [cited 5 August 2025]. Available from: https://www.cdc.gov/nchs/pressroom/releases/20250624.html
[4] Statista. Americans without health insurance [Internet]. Statista; [cited 5 August 2025]. Available from: https://www.statista.com/statistics/200955/americans-without-health-insurance
[5] Congressional Budget Office. Estimated budgetary effects of H.R. 1, the One Big Beautiful Bill Act [Internet]. Washington, DC: CBO; 4 June 2025 [cited 5 August 2025]. Available from: https://www.cbo.gov/publication/61461
[6] Kaiser Family Foundation. Section 1115 Waiver Tracker: Work Requirements [Internet]. San Francisco: KFF; 2025 Aug 1 [cited 5 August 2025]. Available from: https://www.kff.org/report-section/section-1115-waiver-tracker-work-requirements
[7] Kaiser Family Foundation. Tracking the Medicaid Provisions in the 2025 Budget Bill [Internet]. San Francisco: KFF; 8 July 2025 [cited 5 August 2025]. Available from: https://www.kff.org/tracking-the-medicaid-provisions-in-the-2025-budget-bill
[8] Hinton E, Rudowitz R. 5 Key Facts About Medicaid Work Requirements [Internet]. San Francisco: Kaiser Family Foundation; 18 February 2025 [cited 5 August 2025]. Available from: https://www.kff.org/medicaid/issue-brief/5-key-facts-about-medicaid-work-requirements
[9] Basu S, Patel S, Berkowitz SA. Projected Health System and Economic Impacts of 2025 Medicaid Policy Proposals. N Engl J Med. 13 June 2019;380(24):2287–96. doi: 10.1056/NEJMsr1901772.
[10] Gordon R. More Than 100,000 Michigan Residents Nearly Lost Medicaid Coverage under Work Requirements [Internet]. New York: The Commonwealth Fund; 12 May 2025 [cited 5 August 2025]. Available from: https://www.commonwealthfund.org/blog/2025/michigan-residents-nearly-lost-medicaid-coverage
[11] Hinton E, Diana A, Rudowitz R. A Closer Look at the Work Requirement Provisions in the 2025 Federal Budget Reconciliation Law [Internet]. San Francisco: Kaiser Family Foundation; 30 July 2025 [cited 5 August 2025]. Available from: https://www.kff.org/medicaid/issue-brief/a-closer-look-at-the-work-requirement-provisions-in-the-2025-federal-budget-reconciliation-law
[12] Kaiser Family Foundation. Health Provisions in the 2025 Federal Budget Reconciliation Law: Medicaid [Internet]. San Francisco: KFF; 4 August 2025 [cited 5 August 2025]. Available from: https://www.kff.org/report-section/health-provisions-in-the-2025-federal-budget-reconciliation-law-medicaid
[13] Rudowitz R, Corallo B, Garfield R. New Incentive for States to Adopt the ACA Medicaid Expansion: Implications for State Spending [Internet]. San Francisco: Kaiser Family Foundation; 17 March 2021 [cited 5 August 2025]. Available from: https://www.kff.org/medicaid/issue-brief/new-incentive-for-states-to-adopt-the-aca-medicaid-expansion-implications-for-state-spending
[14] Hulver S, Burns A, Mathers J. Reconciliation language could lead to cuts in Medicaid state-directed payments to hospitals and nursing facilities [Internet]. San Francisco: Kaiser Family Foundation; 27 June 2025 [cited 5 August 2025]. Available from: https://www.kff.org/medicaid/issue-brief/reconciliation-language-could-lead-to-cuts-in-medicaid-state-directed-payments-to-hospitals-and-nursing-facilities
[15] Ortaliza J, McGough M, Cox C, Pestaina K, Rudowitz R, Burns A. How Will the One Big Beautiful Bill Act Affect the ACA, Medicaid, and the Uninsured Rate? [Internet]. San Francisco: Kaiser Family Foundation; 18 June 2025 [cited 5 August 2025]. Available from: https://www.kff.org/policy-watch/how-will-the-2025-budget-reconciliation-affect-the-aca-medicaid-and-the-uninsured-rate
[16] Liptak K, Holmes K. Inside Trump’s last 24 hours as he willed his agenda bill over the finish line. CNN [Internet]. 3 July 2025 [cited 5 August 2025]. Available from: https://amp.cnn.com/cnn/2025/07/03/politics/how-trump-passed-agenda-bill
[17] Liptak K, Holmes K. How the Passage of the “Big, Beautiful Bill” Could Impact Med Students and Hospitals. U.S. News & World Report [Internet]. 18 July 2025 [cited 5 August 2025]. Available from: https://www.usnews.com/news/national-news/articles/2025-07-18/how-the-passage-of-the-big-beautiful-bill-could-impact-med-students-and-hospitals
[18] Smith J, Johnson A, Lee R. Projected Effects of Proposed Cuts in Federal Medicaid Funding on Health Outcomes. Ann Intern Med. 15 July 2025;25(7):716–723. doi: 10.7326/ANNALS-25-00716.
[19] Werner RM, Coe NB, Roberts ET, Galvani AP, Pandey A, Ye Y. Projected Mortality Impacts of House-Passed Budget Reconciliation Bill Provisions [Internet]. Washington, DC: U.S. Senate; 3 June 2025 [cited 5 August 2025]. Available from: https://www.sanders.senate.gov/wp-content/uploads/LDI-Yale-Letter-Final-1.pdf
[20] Leonard Davis Institute Staff. Estimated Overdose Deaths Due to the Loss of MOUD in the One Big Beautiful Bill Act [Internet]. Philadelphia: University of Pennsylvania; 2 July 2025 [cited 5 August 2025]. Available from: https://ldi.upenn.edu/our-work/research-updates/estimated-overdose-deaths-due-to-the-loss-of-moud-in-the-one-big-beautiful-bill-act
7.2.1. Insurance coverage and usual source of care
In 2017 it is estimated that 28.5 million Americans did not have health insurance coverage at some point during the year, constituting 8.8% of the total population. This is down considerably from the 58.5 million people estimated to be uninsured in 2013 before implementation of the major coverage expansions included in the ACA. Researchers have also tried to estimate the number of people who were underinsured, and not surprisingly, the figure is much higher – an estimated 28% of insured adults have been defined as underinsured (Collins et al., 2017).[13]
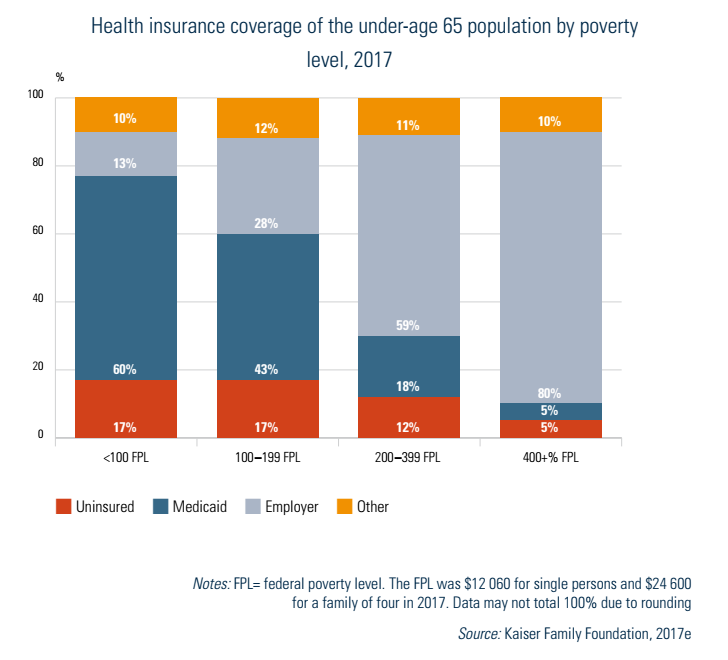
The distribution of the uninsured is skewed towards those who are economically most vulnerable. In 2017, 17% of those under age 65 with incomes below the FPL,[14] and an equal percentage between 100 and 200% of the FPL, were uninsured (Fig7.1). In contrast, uninsurance rates were 5% for those above 400% of the FPL. Coverage also varies considerably by race/ethnicity (not shown in figures). Among those under the age of 65, about 7% of non-Hispanic Whites, 11% of African Americans and 7% of Asians are uninsured. This compares to 20% of Hispanics/Latinos (US Department of Health and Human Services, 2017, Table 105).
Fig7.1
Immigration status is also highly correlated with uninsurance. In 2017 uninsurance rates among US citizens under age 65 was 10%, compared to 24% for legal immigrants and 47% for undocumented immigrants (Kaiser Family Foundation, 2019h).
There are also major disparities with regard to geographical location, usually reflecting relative incomes, employment opportunities and the generosity of Medicaid eligibility criteria in the states of each region. Uninsurance rates are much higher in the South than the Northeast, with the Midwest and West falling in between. The rate was 6.5% among adults aged 18–64 in the Medicaid expansion states, compared to 12.2% for the other states. The highest rate was Texas at 17.3% and the lowest was Massachusetts at 2.8% (Keith, 2018b).
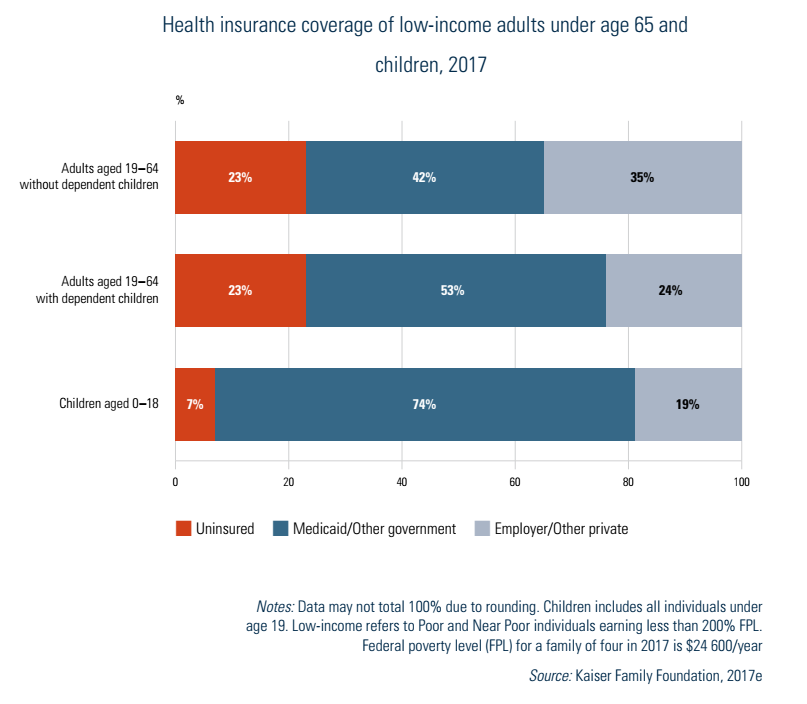
Poor and near-poor children are the one age group that has had better access to insurance coverage. Their uninsurance rate of 7% was less than one third as high as adults with incomes below 200% of the FPL (Fig7.2). The lower rates for poor and near-poor children reflect in part a US policy initiative – specifically, CHIP. The purpose of the programme, which began in 1997, was to provide insurance coverage for uninsured children whose families had low incomes but whose incomes were not low enough to qualify for Medicaid. Medicaid rules in most of the non-expansion states prohibit coverage for adults without children or may make it difficult for adult parents to qualify (except for pregnant women). In contrast, Medicaid income eligibility limits for children are higher than for adults. Moreover, lower income adults often work for small firms and others that typically are not required to provide health insurance.
Fig7.2
In the United States there is a direct relationship between insurance status and having one’s usual source of medical care at a doctor’s office. Generally, those with private health insurance and Medicare have access to medical care private practices. This is not the case, however, for most of the uninsured and many of those on Medicaid. Because Medicaid pays substantially less than other insurers, particularly in some states, physicians often limit the number of Medicaid enrollees in their practice.
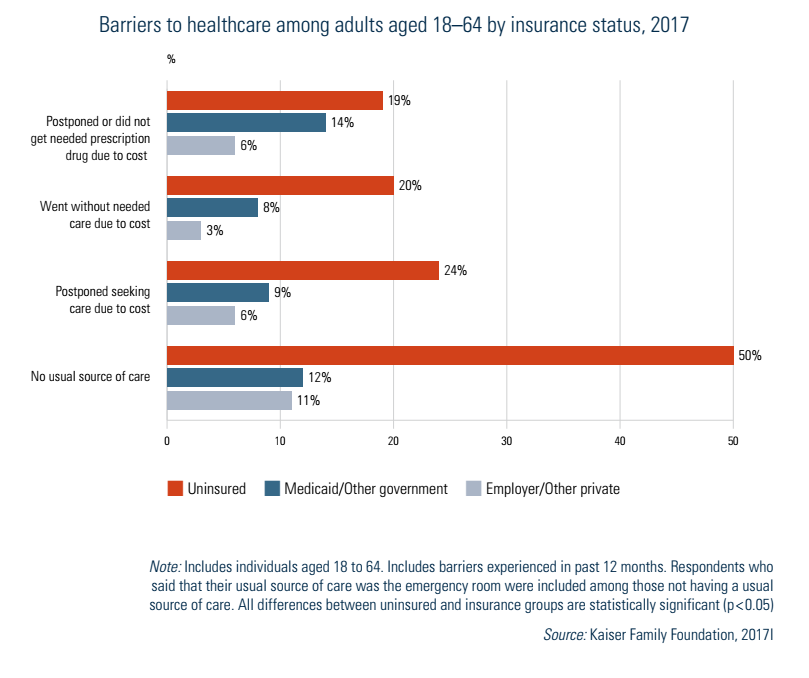
As shown in Fig7.3, those who have insurance nearly always have a usual source of care, irrespective of income. In contrast, only half of those who are uninsured report a regular source of care. The other bars in Fig7.3 show that the uninsured are much more likely than those with either employer-based or Medicaid coverage to report not obtaining needed care or prescription medicines, or postponing care, due to costs.
Fig7.3
- 13. Underinsurance was defined as spending, excluding premiums, of 10% or more of income (5% for those below 200% of the FPL) or having a deductible more than 5% of household income (Collins et al., 2017). ↰
- 14. In 2017 the FPL was US$ 12 060 for a single person and US$ 24 600 for a family of four. ↰
7.2.2. Impediments caused by lack of financial resources
Not surprisingly, lacking insurance also has other consequences, including difficulty accessing cancer screening and treatment. Mammography use among uninsured women aged 40–64 is only 30%, compared to 58% for those with Medicaid and 72% for women with private insurance. This appears to be due to insurance rather than SES as rates for Blacks (70%) are higher than for Whites (66%) (Kaiser Family Foundation, 2018c).
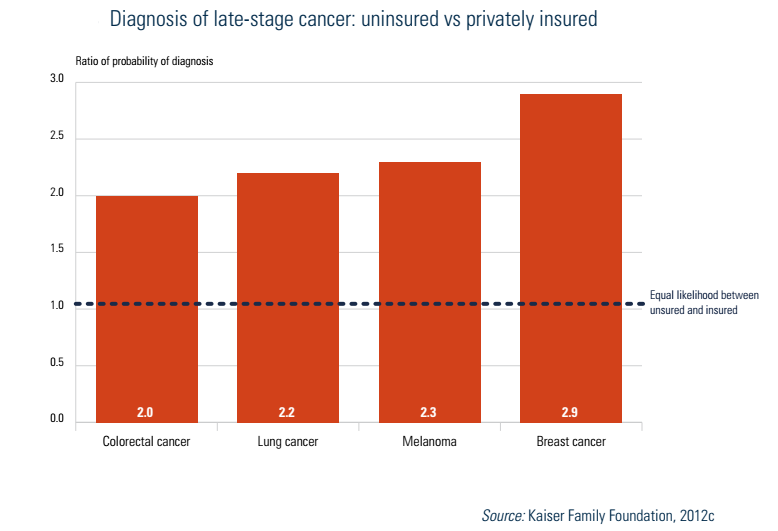
One other impact is noteworthy: the stage at which a person is diagnosed for particular cancers. In all four cancers shown in Fig7.4 – colorectal, lung, melanoma and breast – the uninsured are between two and three times as likely as the insured to be diagnosed at stage III or IV compared to stage I.
Fig7.4
Comparative international data used in this section are obtained from representative surveys of the general population, sicker adults and PCPs conducted by the Commonwealth Fund, a US-based foundation.
Compared to several other high-income nations included in the survey, access problems due to the cost of medical care are greater in the United States. Table7.1 examines sicker adults[15] in 2016 with regard to those (a) not filling a prescription or skipping doses; (b) not visiting a doctor when having a medical problem; and (c) not getting recommended tests, treatments or follow-up visits – all due to costs. Among respondents, 42% reported having one or more of these problems over the past year, which was proportionally 40% higher than any other country and more than twice as high as seven of the 10 countries (not shown in Table7.1). In nearly all cases Americans reported these problems far more often than those in other countries. The only exceptions were for one measure of access in Canada (skipping dental care) and in France (trouble paying bills).
Table7.1

- 15. This is defined as being in fair or poor health, having had surgery or been hospitalized in the past two years or having received care for serious or chronic illness, injury or disability in the past year. ↰
7.2.3. Waiting times
Table7.2 shows several indicators of waiting times in 11 high-income countries in 2016. Results are presented from three questions on how quickly respondents saw a doctor or nurse the last time they needed care, the length of waiting time to see a specialist, and the length of waiting time for elective surgery.
Table7.2

The United States performed well internationally with regard to seeing a specialist and getting elective surgery, with waiting times either second or third lowest. Germany, France, the Netherlands and Switzerland performed well in these two measures, and Canada worst. The picture is somewhat different for primary care. The United States ranked 8th out of the 11 countries. The Netherlands and New Zealand performed best, and Canada and Norway worst. The US rankings are not surprising. Access to specialty care and surgery is relatively high because there are ample resources (of both specialists and equipment for performing procedures) and few restrictions on what and how much medical equipment hospitals, other health facilities and physicians can purchase and own.
7.2.4. Other access issues involving insurers and providers
Two other aspects of access are examined here: troubles with insurers and access to providers. Beginning with the former, the 2016 Commonwealth Survey asked about two problems dealing with insurers or government payers: (1) spending a lot of time on paperwork or having disputes over medical bills, and (2) having payment denied or the size of the payment being less than expected. The results from 11 countries are shown in Table7.3. For each of these issues the United States and France performed worst; in contrast the problems were miniscule in many of the other countries.
Table7.3

The poor US performance is again not surprising. Insurance benefits vary by insurer and co-payments are normally required. Often there are in-network providers vs out-of-network providers, as well as benefit tiers in pharmaceuticals, which can be confusing and are often the source of disputes. Finally, most health insurers are for-profit so there is at least some economic incentive to deny or reduce payment, though such practices, if overbearing, will reduce satisfaction among enrollees and could result in lower enrolment in subsequent years.
Access to providers was discussed in section 3.3.2 in the context of Medicaid. In short, because programme payments are so low in many states, it is often difficult for Medicaid enrollees to find a physician willing to treat them. In such instances, care is frequently sought from community clinics or hospital EDs.
7.2.5. Progressivity of the financing system
The progressivity of a health care financing system is often measured by whether people with higher incomes and wealth pay a greater proportion of their incomes or wealth towards the financing of health care than do people with less income and wealth. If so, the system is considered to be progressive. If those of lower means pay a higher fraction of their income or wealth to finance health care than do wealthier people, the system is viewed as regressive.
Since the United States does not have a single source of insurance, it is difficult to assess overall progressivity. Such an analysis needs to take into account several types of payment, including premiums for public and private coverage; OOP costs; taxes at the federal, state and local levels; and tax expenditures such as the deductibility of health insurance premiums from taxes. An effort to summarize progressivity was undertaken by Patricia Ketsche and colleagues (2011).
Overall, it was found that the US health care financing system was somewhat regressive. On average, Americans paid 15.5% of their incomes towards health care. Interestingly, the proportions of income spent in the four highest quintiles were about the same, varying from 14.8% to 16.0%. The poorest quintile, however, spent more – 22.7% of income.
7.2.6. How the ACA affected access and equity
There are three major ways in which the ACA increased access and/or equity. Firstly, private health insurance coverage rose as a result of the employer and individual insurance mandates, coupled with subsidies provided to purchase health insurance. Secondly, Medicaid coverage increased in the expansion states because programme eligibility rules were liberalized; in those states all poor and near-poor persons with incomes up to 138% of the FPL became covered. Thirdly, some of the financing is progressive: individuals with incomes over US$ 200 000 and families with incomes above US$ 250 000 pay additional payroll taxes as well as income taxes on their investment incomes to help finance the insurance subsidies and Medicaid expansions. More generally, another way in which the ACA increased health equity was making those with pre-existing medical conditions or a history of illness eligible to purchase insurance at the same price as others.
7.2.7. Racial and ethnic minorities, low-income individuals, the uninsured and other vulnerable populations
Discussion regarding the health and health care issues of racial and ethnic minorities, low-income individuals and the uninsured is combined because these populations frequently overlap. Many individuals who are low income are also uninsured, and many low-income and uninsured individuals belong to racial and ethnic minorities. Programmes for improvement often address all these populations simultaneously. There are, of course, separate issues within each population. Racial and ethnic minorities, for example, face discrimination and health care treatment that is different from that of non-minorities (Cogburn, 2019). When overlaps occur, there are numerous social, cultural, economic and structural barriers to accessing quality health care and to being in good health.
The demographics of race, ethnicity, low income and lack of insurance in the United States are briefly as follows: in 2018 racial and ethnic minorities were around 40% of the US population: 13.4% were Black or African American, 18.3% were Hispanic, 5.9% were Asian and 2.4% were other minority races and ethnicities (US Census Bureau, 2018). Nearly 12% of the US population was in official poverty in 2018, a percentage that decreased since 2014 (Semega et al., 2019). The official poverty statistic must be interpreted with caution since the threshold set by the US government has been criticized for being too low (Haveman et al., 2015). Even so, estimates based on this measure place one third of Americans near poverty (Haymes, Haymes & Miller, 2015). In addition, income and wealth disparities have become large. In 2017 earners in the highest income quintile made over half of all income compared to the lowest quintile which made only 3% (Semega et al., 2019). In comparison to other OECD countries in 2017 the United States had the third highest income Gini coefficient (OECD, 2017). Over 14% of the population aged 18–64 had no health insurance in 2018 and 45% were underinsured (Collins, Bhupal & Doty, 2019; Witters, 2019).
Examining the interconnections between these demographics we find that those with low incomes are more likely to be uninsured than those with higher incomes (Burtless & Svaton, 2010). Blacks and Hispanics are more likely to have a low income than Whites (Akee, Jones, & Porter, 2019; DeNavas-Walt, & Procto, 2015) and less likely to have health insurance (Health Affairs Health Policy Brief, 2018; US Census Bureau, 2016a). The health of racial and ethnic minorities is generally poorer than that of Whites (Cogburn, 2019), the health of low-income persons is poorer than that of persons with higher incomes (Chetty et al., 2016), and the health of those without insurance is poorer than that of the insured (Sommers, Long & Baicker, 2014; Wilper et al., 2009). Income-based health disparities in the United States are among the highest in the world, as poor adults are five times as likely to report being in poor or fair health than those >400% above the poverty level (Health Affairs Health Policy Brief, 2018).
Health care contributes to health disparities in terms of both access to care and the quality of care (AHRQ, 2018; Richardson & Norris, 2010). Disparities in access to care are more than just financial barriers, such as lack of insurance, but also include geographical, provider and cultural barriers (AHRQ, 2018; Richardson & Norris, 2010). While it is clear that those with low income and lack of insurance will have difficulty with access to health care, racial and ethnic minorities experience disparities in access to health care that cannot be explained by income and insurance status (AHRQ, 2018; Cogburn, 2019).
Research indicates that racial and ethnic minorities may receive poorer quality of care than Whites in the United States (AHRQ, 2020; Bristow et al., 2013; Hassett et al., 2016; Rodriguez et al., 2011; Schwamm et al., 2010). Discrimination appears to play a role (Benjamins & Middleton, 2019; Cykert et al., 2017; Perez et al., 2009; Sorkin, Ngo-Metzger & De Alba, 2010). In addition, there is also evidence that having insurance, as well as the type of insurance one has, is related to the care received in hospitals (Bristow et al., 2013; Hassett et al., 2016; Spencer, Gaskin & Roberts, 2012).
Federal, state and private agencies have worked at reducing disparities in health and health care for these populations for a number of years. At the federal level, as mentioned earlier, the ACA has improved access to care for low-income and uninsured individuals. Improvement is being accomplished through expansion of Medicaid, individual health insurance through the ACA marketplaces and, CHCs, emphasis on PCMHs, support to build the professional health care workforce, and other measures.
Despite the advances under way with the ACA, more remains to be done. Some federal programmes tasked with reducing health disparities are the National Center on Minority Health and Health Disparities (NCMHD), a part of the NIH, the AHRQ and the HRSA (Anderson, 2012; HRSA, 2018). Through its research programmes and activities on health disparities, the NCMHD brings national attention to the issue (Anderson, 2012). An online resource run by the NCMHD – HDPulse – provides a portal that enables public health professionals and researchers to access data, published reports and public use files related to health disparities and access.
The AHRQ publishes a biannual National Healthcare Disparities Report on the state of health care disparities in the United States and opportunities for reducing them (AHRQ, 2018). Effectiveness of care, patient safety, timeliness, patient-centredness, efficiency and access to care are assessed. The 2018 report found that some disparities had lessened, but some persist, especially for the poor and uninsured. Quality measures were 40% worse for Blacks and 33% worse for Hispanics than for Whites.
The HRSA supports multiple programmes at national, state and local levels to reduce health disparities. These include initiatives in maternal and child health, primary health care access and quality, HIV/AIDS, the health workforce, and rural/urban and geographical disparities.
Other vulnerable populations in the United States include the disabled, the homeless, women, children, persons with HIV/AIDS, the mentally ill, the elderly and those living in rural areas. Federal, state and private agencies have programmes for reducing disparities in health and health care for these populations. Populations that have special access to health services include Native Americans and Alaska Natives, military personnel, veterans and those who are institutionalized, such as prisoners.