-
31 January 2025 | Policy Analysis
United States of America to leave the World Health Organization
7.4. Health care quality
High-quality care and the best possible health outcomes are the main things that people want from their health care system. While objective measures are generally seen as most important, subjective measures are also valued. How people view the care they receive influences how the health care system will evolve. As noted elsewhere in the book, the “managed care revolution” in the early to mid-1990s resulted in a “managed care backlash” just a few years later, which triggered more reliance on PPOs and less on HMOs, which had sometimes employed heavy-handed tactics to manage care. Examples of such tactics included requiring referrals to obtain specialist services, denying coverage after care was received, and putting up administrative barriers that made it difficult for both providers and patients to receive timely reimbursements.
The United States performs well on some measures of quality and outcomes from an international perspective, while it does not perform so well on others. It is important to stress, however, that these measures are skewed by the access problems discussed in section 7.2. To illustrate, even though overall hospitalization rates are lower in the United States than in most OECD countries, the rate for asthma is by far the highest among high-income countries (OECD, 2018a). The high US asthma rate may be due to several factors, including air quality in urban areas or even genetics. A major part of the explanation, however, is poor access to primary care, especially among the uninsured. This is not to say that quality is not a problem; rather, it shows how quality closely interacts with access to care.
On 20 January 2025, President Donald Trump signed an executive order announcing that the US would withdraw from the World Health Organization (WHO). On his first official day back in office, the president cited the “organization’s mishandling of the COVID-19 pandemic . . . and other global health crises, its failure to adopt urgently needed reforms, and its inability to demonstrate independence from the inappropriate political influence of WHO member states,” as well as disproportionate financial contributions compared to other countries as reasons for the withdrawal.
The World Health Organization, comprising 194 member states, promotes global health and safety through data collection, coordinated responses to health emergencies, and setting international health standards, among other roles.
This is not the first time President Trump has issued a withdrawal from the World Health Organization. In 2020, his administration announced a similar withdrawal, but it was ultimately rescinded by his successor President Joseph Biden.
Authors
7.4.1. Objective measures
Voluminous data exist on outcomes and quality of care in the United States. To keep the presentation and discussion manageable, the focus is on indicators where cross-national comparisons are available. The discussion is divided into three sections: prevention and screening, cancer survival rates and asthma admissions. Unless otherwise noted, all data are from OECD (2018a).
Prevention and screening
Beginning with immunizations, Table7.4 shows immunization rates in 2016 among the high-income OECD countries for three diseases: diphtheria, tetanus and pertussis (DTP); hepatitis B; and influenza. The first two show the percentage of children immunized; for influenza it is the percentage of the population aged 65 and older.
Table7.4
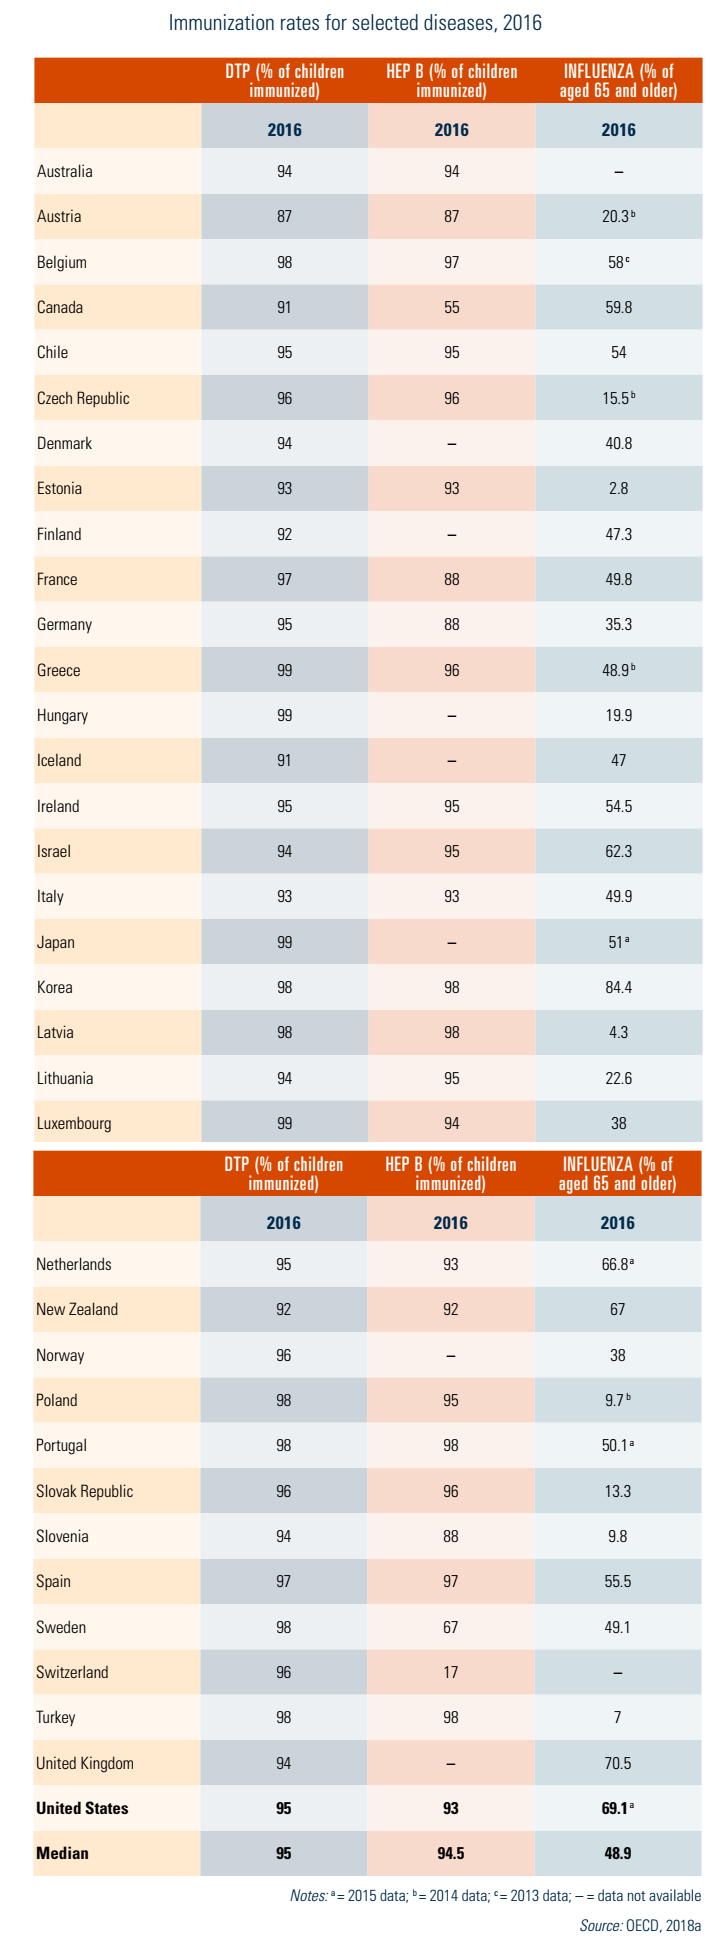
The US rates are DTP, 95%; hepatitis B, 93%; and influenza, 69%. The United States is at the median for DPT and slightly below it for hepatitis B, but ranks high internationally for influenza vaccinations.
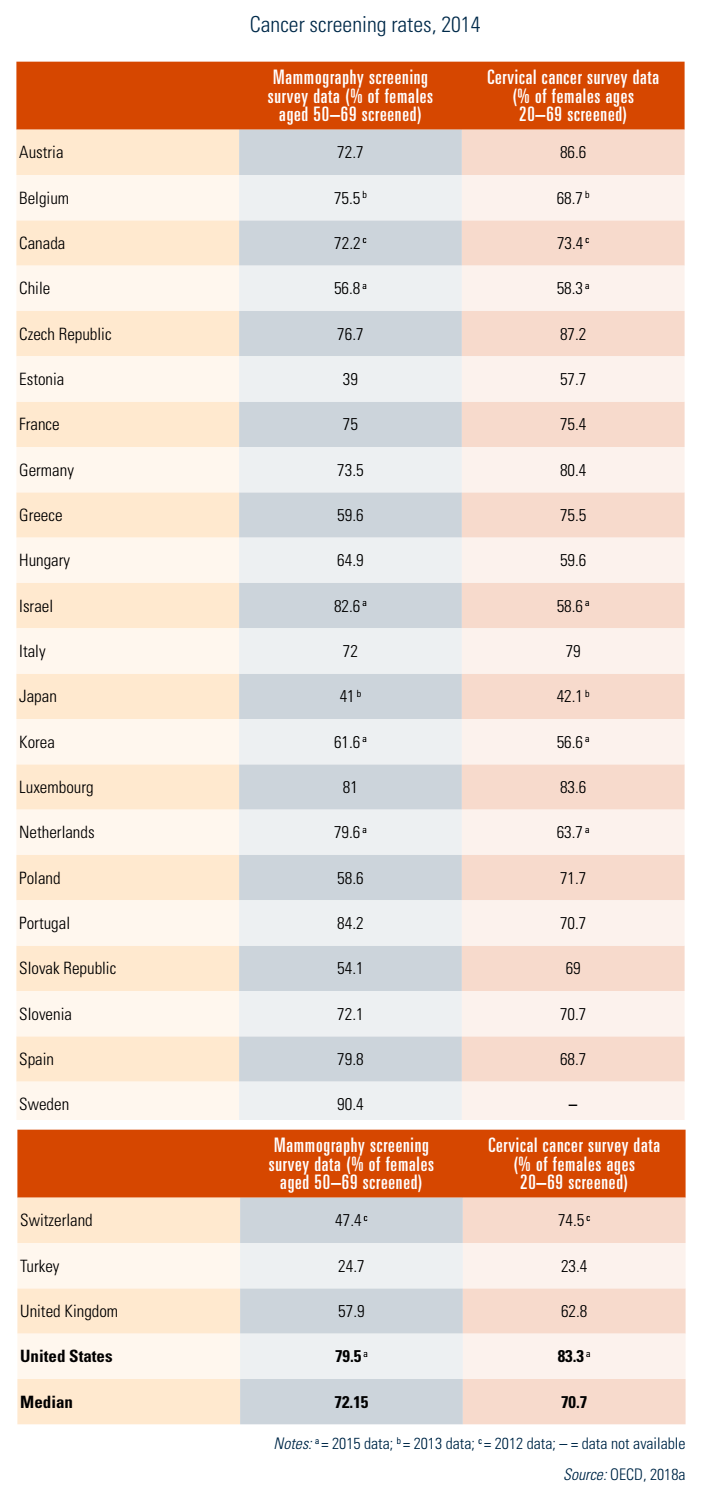
Table7.5 shows screening rates for breast cancer (mammography) and cervical cancer (Pap smears) for 2014, the most recent year with complete data. The OECD data present both population survey data and programme data; shown here is the former because there are no programme data available for the United States. Of the 26 countries compared, the United States was among the top performers in both screening tests, 7 percentage points above the median for mammography and 13 percentage points higher for cervical cancer screening.
Table7.5
Cancer survival
Cancer survival is often considered a good measure of the quality of a medical care system because high survival rates are related both to preventive (screening) care and to treatment success. Fig7.6 shows cancer survival rates in eight countries for three types of cancer that are amenable to treatment when detected early: breast (among women), colon and leukaemia (among children).
Fig7.6
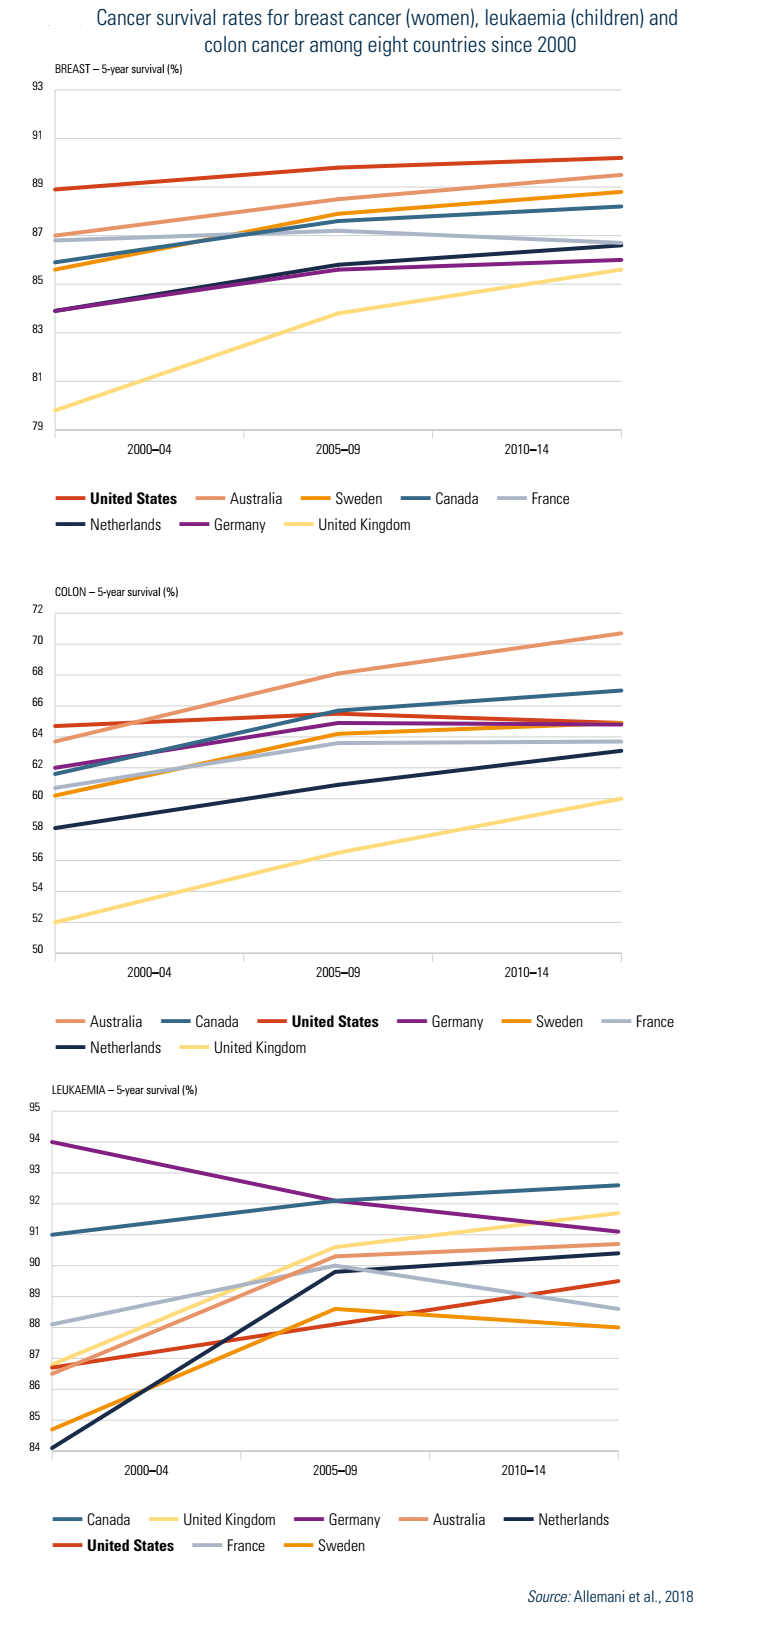
The United States has the highest survival rate for breast cancer, at 90%, and has been the highest over the 10-year period examined. Rates for the other countries are not too far behind, all exceeding 85%. The United States is closer to the average for colon cancer survival, at 65%. Again, the countries are fairly tightly bunched, all with rates between 65% and 71%. This is even more true for leukaemia survival, with all countries having rates in the narrow range of 88–91%, with the United States slightly lower than the average.
In-hospital mortality rates
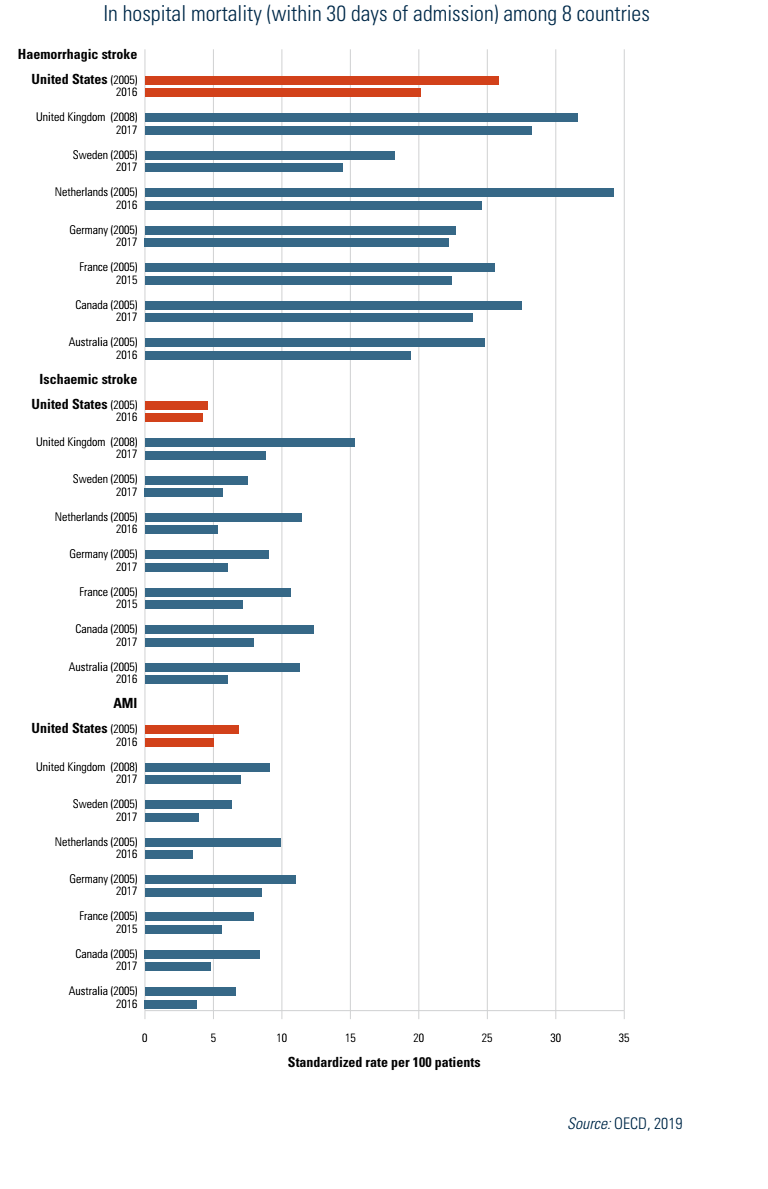
Fig7.7 shows in-hospital mortality (within 30 days of admission) for the same eight countries, for three illnesses: haemorrhagic stroke, ischaemic stroke and AMI. US performance varied by condition. It has by far the best rates with regard to ischaemic stroke mortality, with figures one third less than the second best-performing country, and half those of Canada and the United Kingdom. In contrast, the United States ranked sixth in AMI mortality and fourth in haemorrhagic stroke mortality.
Fig7.7
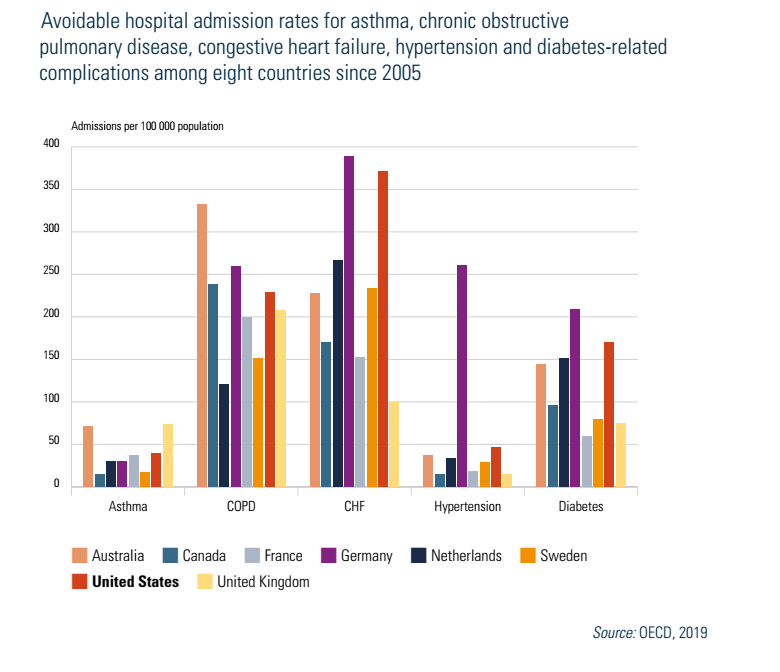
Avoidable hospital admissions
Fig7.8 shows avoidable hospital admission rates among the same eight countries for five diseases and conditions: asthma, COPD, congestive heart failure, hypertension and diabetes. In most cases the United States fares poorly in international comparisons, with the highest rate for asthma and the second highest for heart failure, hypertension and diabetes. It was among the median for COPD. The reason for its poor relative performance likely varies by disease/condition. In the case of asthma it most likely relates to cost-related access barriers. In the case of diabetes, high obesity rates are likely a cause.
Fig7.8
7.4.2. Subjective measures
Although objective measures of quality might normally be considered the “gold standard”, there are two reasons why subjective measures need to be considered as well. Firstly, perceptions do matter. If a patient or a physician believes that the care provided or some other aspect of a health care system is below par, this is a legitimate indicator of quality.[16] Secondly, for many measures of quality, objective data are not available in many countries. An example is medical errors. While studies of the prevalence of error rates have been conducted in some countries, they use different methodologies and time periods and generally are not comparable.
The leading source of subjective data for international comparisons is the Commonwealth Fund, using annual surveys of patients or physicians that have been conducted in up to 11 countries since 2007.
Table7.6 examines three aspects of care coordination: (1) primary care doctors always or often receiving timely and relevant information after a patient sees a specialist; (2) primary care doctors always or often receiving information about changes to a patient’s medication or care plan after a patient sees a specialist; and (3) specialists lacking medical history or regular doctors not informed about specialist care. The United States was at the median for the first measure of coordination, but third lowest for the second measure and tied for lowest in the third measure. Thus, compared to other countries, care coordination is a problem.
Table7.6
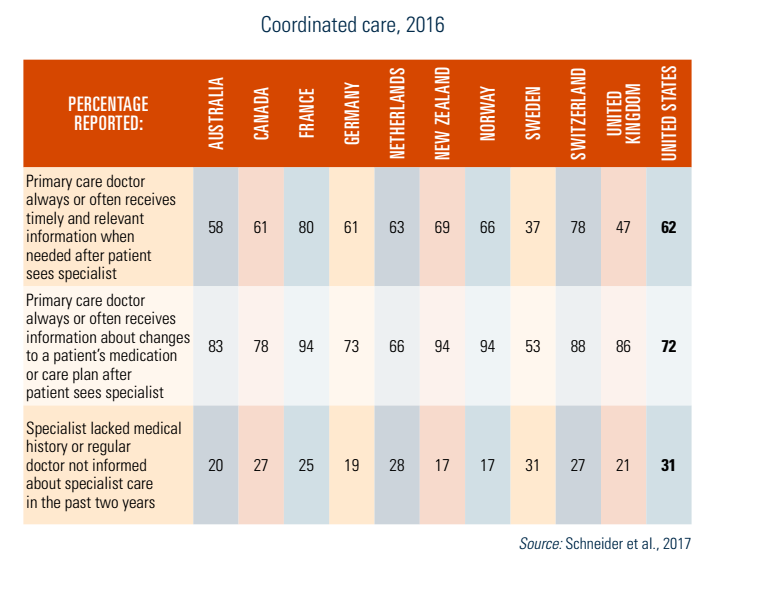
Table7.7 examines patient safety. Three facets are shown: (1) a patient experienced a medical, medication or laboratory mistake; (2) a primary care physician reported electronic clinical decision support in their practice, and (3) a health care professional did not review medications in past year (among those taking two or more prescriptions). The United States had the second worst performance on the first measure, but the best performance on the last. Regarding electronic support, the United States performed above the median.
Table7.7
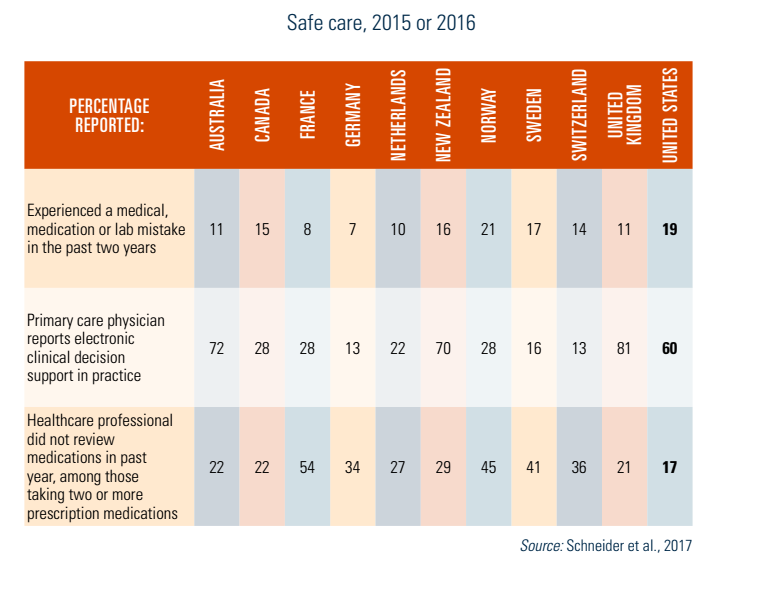
Table7.8 examines three measures of the doctor–patient relationship: (1) regular doctor always or often spent enough time with patient and explained things in an understandable way; (2) doctor always treated patient with courtesy and respect during hospital stays; and (3) chronically ill patients discussed treatment options with their health professionals. In each of the three measures, US performance was around the median.
Table7.8
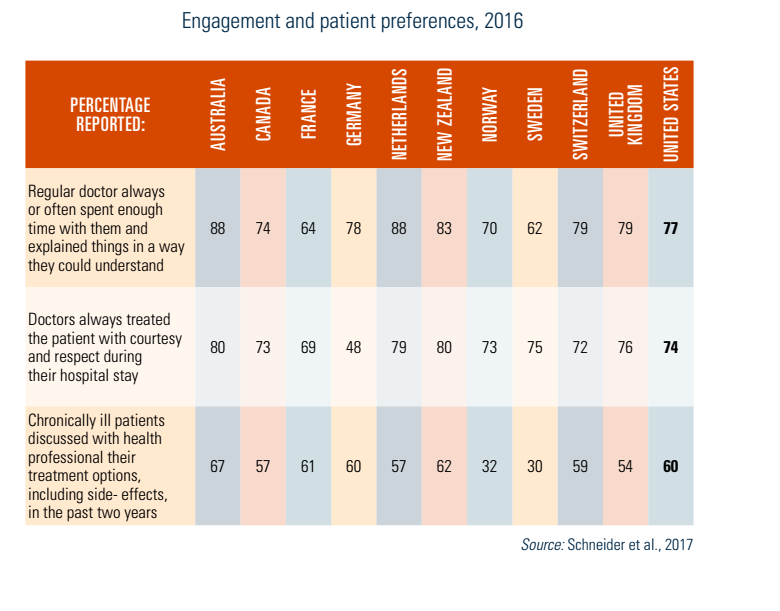
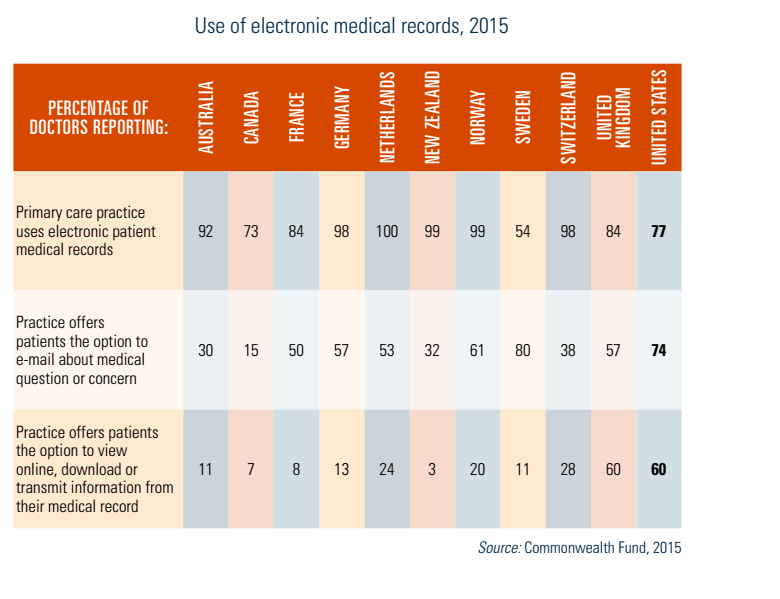
Table7.9 examines three ways in which primary care practices report using medical records: (1) the practice uses EMRs; (2) the practice offers patients the option of emailing queries to practice providers; and (3) the practice offers patients the option to view online, download or transmit information from their medical record. The United States was not very different from average for the first two measures, but had the highest figure, by far, in allowing patients to use information electronically from their medical records.
Table7.9
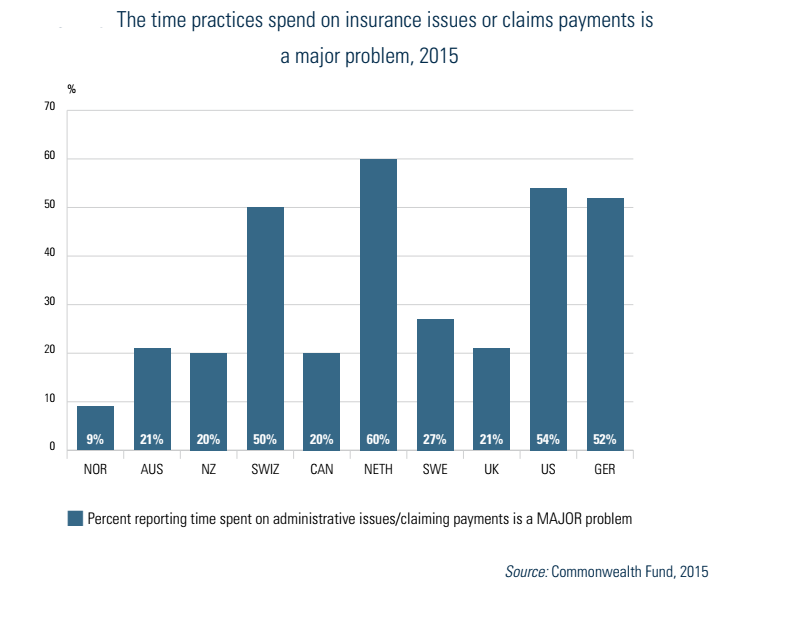
Finally, we examine two aspects of physician satisfaction. Fig7.9 shows physician satisfaction with practising medicine in 10 countries. Satisfaction in the United States is relatively low compared to most of the other countries, ranking ninth or tenth, with 36% reporting that they are somewhat or very dissatisfied. Fig7.10 shows that a major problem is the proportion of time spent on administrative issues or difficulty receiving payment. As in the previous graphic, US physicians are the second least satisfied, with more than half reporting this complaint.
Fig7.9
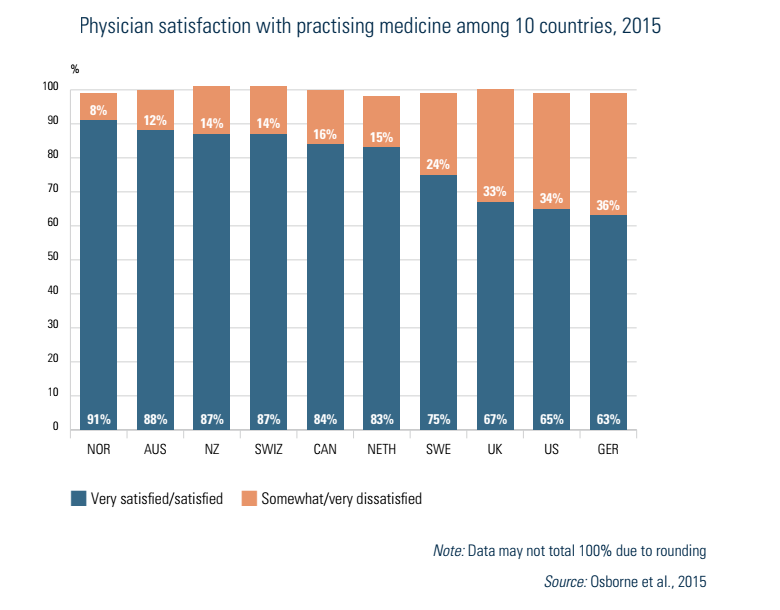
Fig7.10
- 16. Economists, for example, generally view societal welfare based on the sum of individuals’ “utilities”, which are subjective measures of well-being. ↰