-
10 December 2024 | Country Update
Growing concern: one-third of adolescents in Estonia are overweight
1.4. Health status
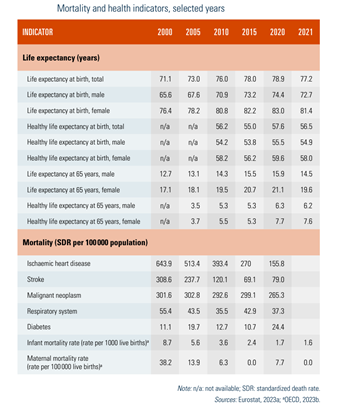
Between 2000 and 2020, life expectancy at birth in Estonia improved by 7.5 years, from 71.1 years to 78.9 years, the highest increase in the EU over this period (Table1.3). Although closer to the EU average, it lags behind by two years. However, because of deaths from COVID-19 and other causes, such as heat-related and alcohol-related deaths, life expectancy fell from nearly 79 years in 2020 to 77.2 years in 2021. In addition, the gender gap in life expectancy narrowed from almost 11 years in 2000 to 8.6 years in 2020. This is the third largest gender gap in life expectancy in the EU after Lithuania and Latvia, and much wider than the EU average of 5.7 years.
Table1.3
Between 2018 and 2020, the number of healthy years at birth increased steadily in Estonia: for both sexes it rose sharply from 53.9 years to 57.6 years. In 2021, the second year of the COVID-19 pandemic, the gains were reversed, and healthy life expectancy fell by 1.1 years to 56.5 years. For women, the reduction was more pronounced, from 59.6 years to 58 years (Table1.3). However, the recent national statistics for 2022 indicate a remarkable increase of 2.7 years in healthy life expectancy, reaching the highest level ever recorded (59.2 years). Similarly, the number of healthy years at age 65 improved between 2000 and 2020, but there was a decrease of almost 1.5 years for men and half a year for women during the COVID-19 pandemic. Furthermore, healthy life expectancy at age 65 for Estonians remains low, at 7.7 years for women and 6.3 years for men. Both sexes spend more than 60% of their remaining years with activity limitations or disabilities. In addition, older women in Estonia report having multiple chronic conditions more often than older men – 34% and 30%, respectively – but less than the EU average (40% for women and 32% for men) (Eurostat, 2023a) (see section 7.5 Health system outcomes).
Compared with the EU average of 69%, significantly fewer people in Estonia (58%) perceived their health to be good or very good in 2021. Moreover, the large gap between income groups showed stark inequalities, with only 36% of adults in the lowest income quintile saying they were in good health and twice as many (78%) in the richest income quintile. Surprisingly, however, more adults in the lowest quintile reported being in good health in 2021, the second year of the COVID-19 pandemic, than in 2020 (33.7%) (Eurostat, 2023a).
Cardiovascular diseases are continuously a leading cause of death in Estonia (49.1% of all deaths in 2020), with ischaemic heart disease alone being attributable to 13.6% of deaths and stroke to 7% (Table1.3). Nevertheless, mortality rates due to these conditions declined by over 70% between 2000 and 2020. The second largest cause of death is cancers (23.3% of deaths in 2020), and external causes are the third largest cause (6.2% in 2020) (Eurostat, 2023a). Overall, mortality rates due to the main noncommunicable diseases, except for diabetes, have been declining (Table1.3).
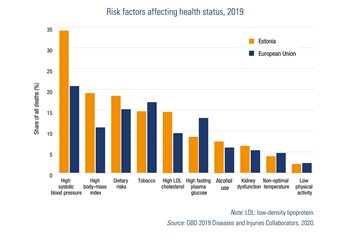
Similar to the causes of death, the main morbidity-related health problems in Estonia are currently cardiovascular diseases, cancers and injuries, although musculoskeletal diseases and mental health problems are gaining importance. A large proportion of the changes in morbidity can be linked to decreasing mortality and increasing life expectancy. As a result, chronic diseases have gradually come to the forefront. Among most prevalent chronic conditions in the adults for both women and men are hypertension and chronic pain (Jürisson et al., 2021). Thirty-four percent of deaths can be attributed to high systolic blood pressure alone (Fig1.2).
Fig1.2
Health behaviour strongly influences the health status of the population. Tobacco consumption is still one of the major public health concerns in Estonia, particularly among men, although smoking rates have decreased significantly since 2000. One in four men reported smoking daily in 2020, and men are twice as likely as women to be daily smokers. The proportion of 15-year-olds who reported having smoked in the past month decreased from 21% in 2014 to 8.9% in 2021. However, the regular consumption of vaping products is becoming more popular among young adults (15–24 years of age), with rates growing up to 12.1% in 2020 (OECD, 2023b). Regarding alcohol use, the proportion of 15-year-olds who reported having been drunk more than once in their life decreased from 50% in the early 2000s to 24.7% in 2021 (Piksööt & Oja, 2023). Overall alcohol consumption among adults has decreased since 2005, and per capita consumption in Estonia (10.4 litres per capita) was below the EU average of 11.0 litres per capita in 2019. However, between 2019 and 2022, following the reduction in alcohol excise tax, the trend changed and showed a slight increase, reaching 11.2 litres per capita. The number of alcohol-related deaths grew substantially, from 383 deaths in 2018 to 753 deaths in 2022, with alcohol becoming the most common preventable cause of death between 2020 and 2022 (see section 7.5 Health system outcomes) (NIHD, 2023b).
Overall levels of leisure-time physical activity among adults have improved slightly. The percentage of adults aged 18 and over doing at least 150 minutes of (moderate) physical activity per week increased from 23.2% in 2015 to 25.8% in 2019. Educational attainment appears to have an impact on physical activity. Only 23% of adults with only primary education spent 150 minutes or more per week doing moderate physical activity, whereas 28.6% of adults with tertiary education reported doing so in 2019 (see section 5.1.3 Disease prevention, health protection and promotion) (Eurostat, 2023a).
Furthermore, around 27% of boys and 25% of girls aged 7 years in Estonia were overweight or obese, according to the results of the Childhood Obesity Surveillance Initiative (COSI) conducted between 2018 and 2020 (COSI, 2022). In 2019, the proportion of overweight males reached 40.6% and 28% of females, whereas obesity was more common among females than males (22.8% and 19%, respectively) (NIHD, 2023b).
According to the estimates from the Global Burden of Disease Study 2019 (GBD 2019 Diseases and Injuries Collaborators, 2020), the behavioural risk factors, including dietary factors, tobacco smoking, alcohol consumption and low physical activity, were associated with 39% of all deaths in Estonia in 2019, which is on a par with the EU average. Nearly one fifth of all deaths could be attributed to dietary risks, a proportion close to the EU average. Tobacco use (including passive smoking) is the second largest behavioural risk factor contributing to mortality, accounting for 15% of deaths (Fig1.2). Alcohol consumption was associated with 8% of all deaths in 2019. Low physical activity accounts for 2% of all deaths, which is in line with the EU average.
The prevalence of communicable diseases, including HIV infection, tuberculosis (TB), sexually transmitted infections and other preventable infections, is declining. Between 2012 and 2021, HIV incidence fell by 60%, to 9.4 cases per 100 000 people in 2021. Despite notable improvements, HIV incidence in Estonia is still among the five highest for countries in the EU, with an average incidence of 3.7 per 100 000 (ECDC & WHO Regional Office for Europe, 2022; Rüütel, Epštein & Kaur, 2022). Incidence of TB has decreased from a peak of 59.2 cases per 100 000 in 1998 to 9.6 per 100 000 in 2019 (NIHD, 2021b). The main concern about TB is the high rate of multidrug-resistant disease, which accounted for an average of 25% of new pulmonary TB infections between 2014 and 2019. In addition, 11.3% of TB patients tested positive for HIV in 2019 (NIHD, 2021b).
Maternal and child health indicators have also improved significantly. Infant mortality has fallen from 8.7 per 1000 live births in 2000 to 1.6 per 1000 live births in 2020 (Table1.3), and maternal deaths related to childbirth are rare.
The study surveyed 18,000 students from 203 schools and found that one in three boys and one in four girls are overweight. This has worsened over time, particularly with the increase in the number of obese children. For example, in 2016, 10% of first graders were obese and 16% were overweight, while by 2022, the number of first graders with obesity rose to 12%. Similarly, the proportion of obese children among fourth graders increased from 12% in 2019 to 14% in 2022, with a total of 34% of all fourth graders being overweight. The 2022 COSI study, which surveyed seventh-graders for the first time, also found alarming rates of obese (11%) and overweight (29%) children [2].
Regardless of age, excess weight is more common among boys, especially obesity, with 15% of boys compared to 9% of girls. The data also show strong disparities: for example, 30%–39% of children in rural areas have excess weight, compared with 26%–33% in urban areas, and children from the families experiencing financial difficulties have higher rates of overweight and obesity than those from families with higher incomes: 33% of overweight and 13% of obesity and 25% overweight and 8% of obesity, respectively [2].


