-
26 January 2025 | Country Update
Improving the interoperability of health information in Canada
4.1. Physical resources
4.1.1. Infrastructure, capital stock and investments
From the late 1940s until the 1960s, Canada experienced rapid growth in the number and size of hospitals due to the growth in demand for inpatient care. This growth was fuelled by national hospital construction grants provided to the provinces by the federal government and by the introduction of public hospital insurance in Saskatchewan, Alberta and British Columbia by the end of the 1940s, and the remaining provinces by the end of the 1950s. This construction boom would produce an overhang of outdated hospital facilities that provincial ministries of health would have to address in subsequent decades through consolidation and closure on the one hand, and the need for additional capital investment on the other (Ostry, 2006).
By the mid-1970s, the investment in hospitals had slowed, and by the 1980s and 1990s, provincial governments were encouraging hospital consolidation with a concomitant reduction in the number of small and inefficient hospitals (Mackenzie, 2004; Ostry, 2006). Consolidation aimed to reduce operating costs and increase organizational efficiencies. Based on a study comparing hospital administrative costs in a selection of OECD countries including France, Germany, the Netherlands, the United Kingdom (England, Scotland and Wales) and the USA, Canada had very low administrative costs within this sample (Himmelstein et al., 2014).
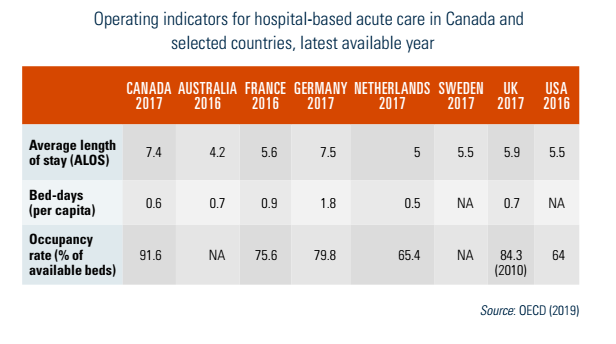
The number of acute care beds per capita has fallen continuously during the past two decades. In this respect, the trend in Canada is similar to the trend observed in comparator OECD countries (Fig4.1). Over the seven years from 2010 to 2017, however, the hospitalization rate increased by 4% in Canada, even though most of the smaller (less populous) provinces and territories experienced a decline in hospitalization rates (Table4.1). This differing trend in hospitalizations between the smaller and larger provinces reflects the initially higher hospitalization rates in the smaller jurisdictions, thus there was more room for efficiency improvements (shifting care outside hospital or to day surgeries) than in the larger provinces. At the same time, the average length of stay (ALOS) in Canadian acute care hospitals, after standardizing for changes in the age and sex distribution, declined slightly from 7.5 days in 1995–1996 to 6.9 days in 2017–2018 (CIHI, 2019c). As shown in Table4.2, Canada has a higher ALOS in hospitals than all other comparable countries except Germany, and a significantly higher occupancy rate than the other countries, a pattern that has been consistent over the past decade (OECD, 2019).
| Fig4.1 | Table4.1 |
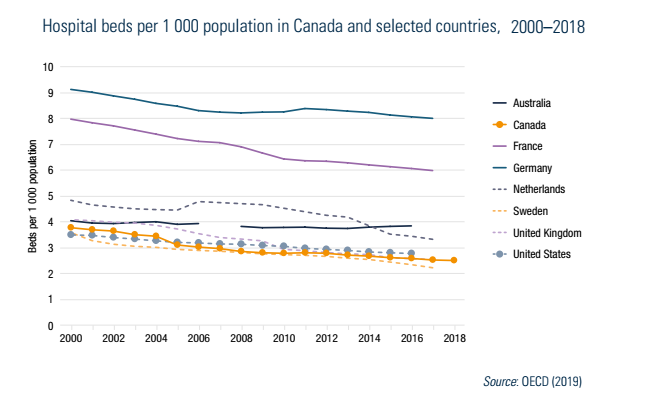 | 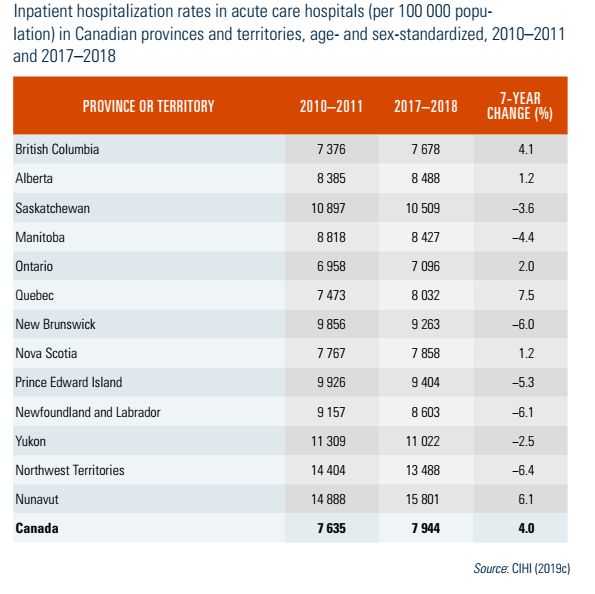 |
Table4.2
Since almost all hospital care is considered a fully insured service under the Canada Health Act and PT medicare plans, public funding is critical to decisions concerning capital expansion and improvement. Public budgeting rules at the PT level require that governments and their delegated health authorities carry capital expenditures as current liabilities. As a consequence, there has been an incentive to reduce capital expenditures more than operating expenditures during periods of budgetary restraint. In addition, governments and health authorities sometimes prefer not to carry the burden of financing infrastructure “up front”.
While some governments and delegated health authorities have explored private finance initiatives (PFI) – known as public–private partnerships or “P3s” in Canada – to finance, manage and deliver health services, it has been more common to contract out the delivery of care to private companies or professional corporations. Almost all free-standing medical laboratories (not including those in hospital and public health laboratories) are owned by private corporations (Sutherland, 2011). In some provinces, premium payments offered by workers’ compensation schemes in combination with the looser regulatory controls placed on diagnostic clinics and the desire by most provincial ministries of health to contract out to private medical laboratories have generated a market for private for-profit facilities (Hurley et al., 2008; Sutherland, 2011).
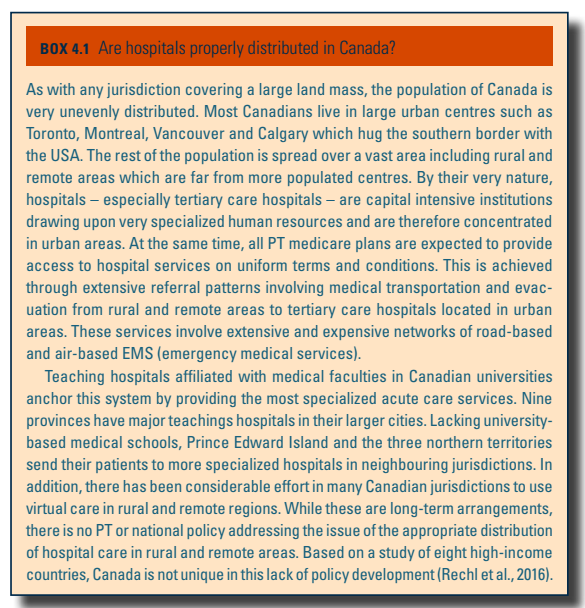
Box4.1 describes the distribution of health facilities in Canada.
Box4.1
4.1.2. Medical equipment
Canada has a decentralized process of purchasing most medical aids and devices, consistent with a decentralized delivery system. Although provincial ministries of health are ultimately responsible for ensuring the availability and quality of medical equipment, devices and aids as part of first-dollar coverage for hospital and medical services, arm’s-length health organizations and providers actually purchase most medical aids and devices. In addition, most physicians maintain private offices and make independent decisions concerning the purchase of a broad range of medical equipment, devices and aids to support their respective general (family) and specialist practices.
Individual clinicians, particularly specialist physicians, play a major role in the decisions of delegated health authorities and hospitals to purchase medical equipment, including the selection of particular vendors. At the same time, provincial health ministries can play a key role in determining the timing and procurement of extremely expensive medical equipment, especially magnetic resonance imaging (MRI) units and computed tomography (CT) scanners. From the early to mid-1990s, provincial governments severely constrained their spending on advanced diagnostics. These actions created a bottleneck, lengthening waiting times for certain conditions and treatments (Romanow, 2002). Since that time, there has been a substantial investment in advanced diagnostics by provincial health ministries and delegated health authorities. As can be seen in Table4.3, Canada is no longer an outlier among its OECD comparators, and the country’s supply of diagnostics is comparable to Australia but significantly lower than in France. The number of examinations has increased over the period 2007 to 2017, from 103.3 to 153 CT examinations per 1000 people, and 31.2 to 51 MRI examinations per 1000 people (CADTH, 2017). The majority of medical imaging is based in hospitals (88%) while the rest is located in free-standing clinics (CADTH, 2017).
Table4.3
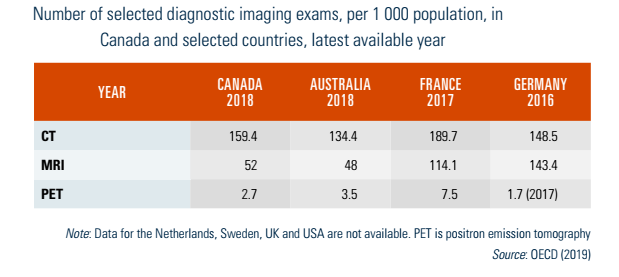
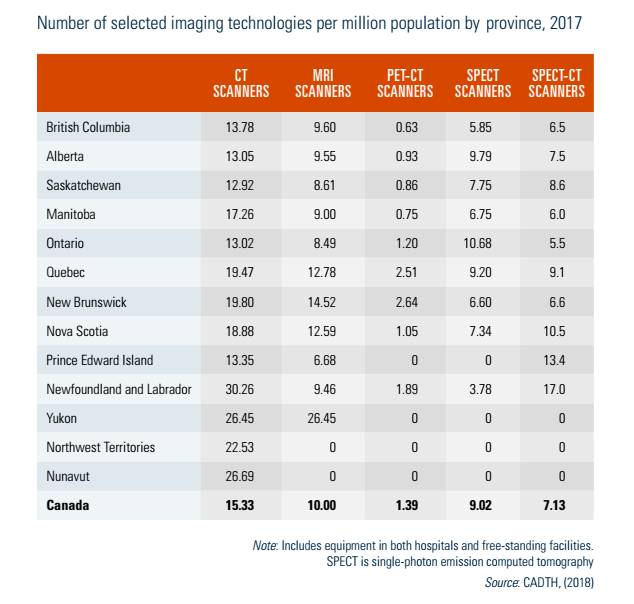
Table4.4 compares the provinces in terms of the number of selected imaging technologies per million population. There are important variations among the provinces and territories, mostly associated with those that have smaller or geographically dispersed populations (e.g. Prince Edward Island and the three territories) and therefore lack the economies of scale to justify investment in some high-cost technologies.
Table4.4
4.1.3. Information technology and e-Health
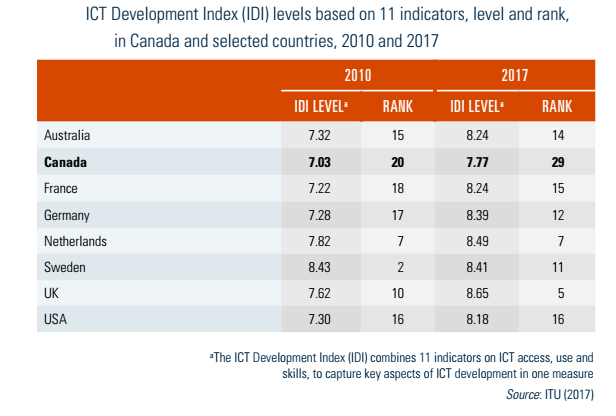
As in all countries, access to the Internet – at home, work and school – has increased dramatically in recent years. Moreover, there is considerable evidence from a number of sources that Canadians use the Internet on a regular basis, including to access both medical and health information (Middleton, Veenhof & Leith, 2010; Statistics Canada 2019h). However, in terms of ICT infrastructure (not specific to health), intensity of access and skill levels, it appears that Canada is not faring as well as other high-income countries. Based on a composite index of 11 indicators measuring ICT access, use and skills, the ICT Development Index (IDI) was developed by the United Nations’ International Telecommunication Union (ITU). In 2017, Canada was ranked in 29th position on this index, considerably lower than Australia (14th), France (15th), Germany (12th), the Netherlands (7th), Sweden (11th), the United Kingdom (5th) and the USA (16th). Moreover, it is the only country other than Sweden in this group to experience a decline in its IDI ranking between 2010 and 2017 (see Table4.5).
Table4.5
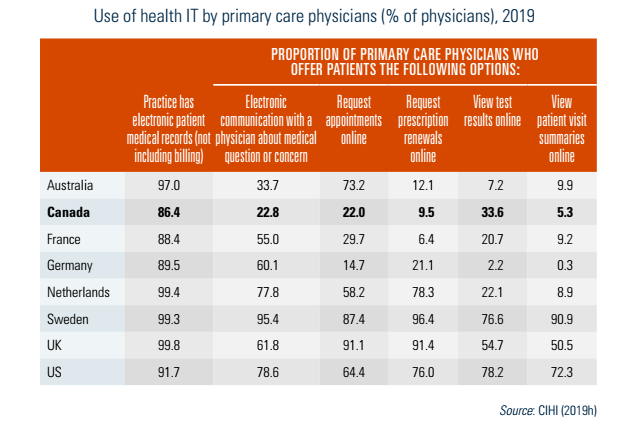
Canada’s performance in the use of ICT for health delivery is also mediocre relative to a number of other developed countries. In a 2019 survey of primary care physicians, the Commonwealth Fund found that 86% of Canadian GPs used electronic patient medical records, which was lower than all other countries (see Table4.6). However, the majority of primary care physicians in Canada do not offer patients health IT services such as electronic communication, requesting appointments and prescription renewals online, and viewing tests online in 2019 (Table4.6). Similarly, few Canadians reported to have access to their own medical records online (15% in 2018), the use of electronic appointment booking was very low (8% of Canadians) and visiting a health care provider virtually by video was rare (3% of Canadians) according to a 2018 survey (Canada Health Infoway, 2018). While there has been some progress made to allow patients to access medical information online, such as with the Québec Health Booklet (Carnet santé Québec) and MyHealth Records in Alberta, these are not yet widely available across Canada, and most online portals for patients to receive laboratory test results and other medical information are specific to an organization (e.g. hospital).
Table4.6