
09 June 2023 | Country Update
The allocation of resources from the 2022 National Health Fund has been approvedAccording to national ISTAT data, current health expenditure in 2019 was equal to €154.8 billion, of which €114.8 billion was publicly funded and the remaining €40 billion was incurred by families and other private entities (Del Vecchio et al., 2020; 2021). Preliminary estimates for 2020 showed a significant increase in public spending (€122.4 billion) and a reduction in private expenditure (€38.1 billion) (Del Vecchio et al., 2021). The COVID-19 pandemic required additional public expenditure to cope with the emergency, while private health care expenditure decreased due to the suspension of non-urgent services and patients’ reluctance to visit health care facilities.
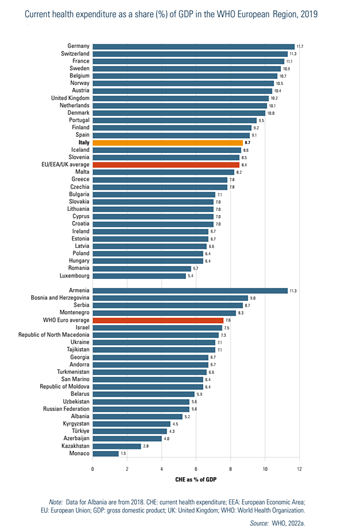
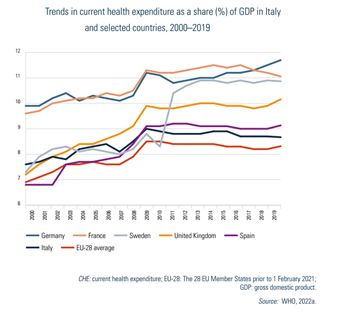
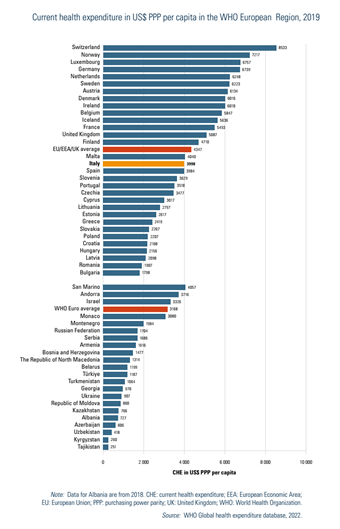
Based on data from the Global Health Expenditure Database in 2019, Italy’s health spending represented 8.7% of GDP (Table3.1 and Fig3.1).[5] The share of GDP for health care grew steadily from 7.6% in 2000 to 8.9% in 2010, then declined slightly to 8.7% in 2019. Although this is a little above the EU average (8.5%), Italy remains the lowest spender when compared with countries such as Spain, France, the United Kingdom and Germany (Fig3.2). In 2019, per capita health expenditure stood at USGDP for health care grew steadily from 7.6% in 2000 to 8.9% in 2010, then declined slightly to 8.7% in 2019. Although this is a little above the EU average (8.5%), Italy remains the lowest spender when compared with countries such as Spain, France, the United Kingdom and Germany (Fig3.2). In 2019, per capita health expenditure stood at US$ 3998 (adjusted for differences in purchasing power). While this is above the average across the WHO European Region, it is somewhat below the average for EU/European Economic Area (EEA) countries and the United Kingdom (Fig3.3).
| Table3.1 | Fig3.1 |
 |  |
| Fig3.2 | Fig3.3 |
 |  |
Over the last two decades, public expenditure on health has fluctuated. It grew by an average annual growth rate of 4.1% from 2000 to 2010, and by only 0.9% from 2011 to 2019. Instead, private expenditure has shown a more constant pattern (about 2.1% average annual increase). The government share of current health care expenditure decreased significantly from 78.5% in 2010 to 73.9% in 2019 (Table3.1). Both public and private health expenditure suffered from the country’s modest GDP annual growth which averaged 2.4% between 2001 and 2010 and only 1.1% between 2011 and 2019. This left little room to increase the share of GDP dedicated to the SSN, given Italy’s very high public debt/GDP ratio. In addition, private expenditure on health did expand despite a weak economy that increased the disposable income of families only modestly.
National data highlights that in 2019, per capita public expenditure by the regional health care systems ranged from €1845 in Campania and €1909 in Sicily (southern Italy) to €2476 in Molise (southern Italy) and €2457 in the Autonomous Province of Bolzano (northern Italy) (Table3.2). Differences are mainly due to funding – northern regions tend to receive more resources due to an older population – and to regions being able to deliver services beyond those guaranteed under the national benefits package (LEA). It is worth noting that the financial flows due to the mobility of patients seeking care outside their region of residence also impacts on regional differences in per capita health spending. These flows tend to go from the southern to northern regions given that public and private-accredited hospitals in northern regions (mainly in Lombardy and Emilia-Romagna) attract patients from southern regions (mainly from Calabria and Campania) (Fattore, Petrarca & Torbica, 2014; Brenna & Spandonaro, 2015). The private share of per capita expenditure shows much greater variation across the country, ranging from a minimum of €423 in Campania to a maximum of €899 in the Valle d’Aosta. These data suggest that private expenditure is mainly related to families’ disposable income (higher in the northern regions) rather than to the performance of public regional health systems (Del Vecchio et al., 2020).
Table3.2
According to national disaggregated data on health expenditure by function and financing scheme (Table3.3), the main areas of health expenditure in 2019 were inpatient care for public (government) expenditure, and outpatient care and pharmaceuticals for private expenditure.
Table3.3
Overall, the last decade (before the COVID-19 pandemic) was dominated by an aggressive cost-containment strategy adopted at the national level and implemented by regions and SSN organizations. This strategy was based on two main types of measures. The first, directed at regions, forced them to adopt regional and local cost-containment measures. For example, the ceiling on pharmaceutical expenditure was expected to activate regional policies to reduce waste and to improve cost-conscious prescribing. In this respect, some regions (mainly in the north and centre) have been more active than others. In 2007, the government introduced a special regime for overspending regions that required the adoption and implementation of formal regional “recovery plans” (piani di rientro). Since then, 10 out of the 21 regional health systems had to adopt these plans, which included actions to address the structural determinants of costs. Currently (2022) seven regions follow these plans. The overall effect of these recovery plans has been a drastic decrease in the yearly level of overspending. In 2019, the overall deficit of the SSN (SSN expenditure minus SSN funding) was close to zero. While these plans were effective in regaining control over expenditure, they also created concern about their negative impact on the quantity and quality of services delivered to citizens. While a few studies found ambiguous evidence about the impact of recovery plans on health (see Bobini et al., 2019), a recent and very rigorous study by Arcà et al. (2020) found that regions that adopted recovery plans had worse outcomes in terms of amenable mortality. The second type of measure targeted SSN organizations directly. Here, the focus was on national personnel contracts, setting caps on the increase of specific expenditure items (e.g. for goods and services) and on containing prices of pharmaceuticals that are set at the national level.
From March 2020, the Italian Government increased SSN funding to address the COVID-19 emergency. Compared with what was originally planned before the pandemic, overall funding for 2020 was increased by more than €5 billion (approximately 4% of the total SSN budget). Additional resources were made available by the government through the Civil Protection Department and the COVID-19 Emergency Commissioner. For example, an important share of the expenses for masks and other protective devices used by SSN personnel, and for ventilators, was directly purchased by these agencies. Most of these expenditures were also incurred in 2021 – in May 2022 total additional national funding for the SSN was recorded as €121.4 million (Camera dei Deputati, 2022a). Also, preliminary data on the financial situation of regions in 2022 signal that some of them are likely to incur important deficits that will need to be covered with regional resources and/or national ones.
On 8 February, 2023, the Interministerial Committee for Economic Planning and Sustainable Development (CIPESS) approved the (retrospective) allocation of available funds for the National Health Service for the year 2022 among the regions and autonomous provinces. The total amount allocated was EUR 125 billion. This allocation was dependent on the Agreement between the State and regions, which was finalized in late December 2022.
In 2022, the National Health Fund saw an increase of approximately EUR 3.9 billion compared to 2021 (+3%). The additional resources were allocated to cover various expenses, including the costs associated with the COVID-19 emergency, vaccination campaigns, an increase in the fund for innovative drugs, rising energy prices, and healthcare personnel expenses. The latter includes fringe benefits for emergency room staff, recruitment of staff for territorial care, specialist training contracts for physicians, as well as efforts to reduce waiting lists. Additionally, the funds were designated for updating the essential levels of care (LEAs) and implementing the “Psychologist Bonus” initiative.